

RIO Press Articles |
| Globe Asia - Jun 2011 |
| Globe Asia - Currency Wars Nov 2010 |
| Player Magazine - Born Trader 2009 |
RIO ARC Reports |
| ARC GBP Report Jul2025 |
| ARC USD Report Jul2025 |
| ARC USD Report Apr2025 |
| ARC GBP Report Mar2025 |
| ARC USD Report Mar2025 |
RIO Platinum USD/GBP Reports |
| RIO Platinum USD Oct2025 |
| RIO Platinum USD Mar2025 |
| Platinum Report Feb2025 |
| RIO Platinum GBP Oct2024 |
| RIO Platinum USD Jun2024 |
RIO Silver Lining Reports |
| Silver Lining GBP Jul2025 |
| Silver Lining Report Feb2025 |
| Silver Lining Report Feb2025 |
| Silver Lining USD Report Oct2024 |
| Silver Lining GBP Report Jun2024 |
RIO Currency Concept Reports |
| Currency Concept Report Apr2025 |
| Currency Concept Report Apr2025 |
| Currency Concept Report Oct2024 |
| Currency Concept Report Jul2024 |
| Currency Concept Report Dec2023 |
RIO Property Reports |
| RIO Property Oct2025 |
| Property Report Apr2025 |
| Property Report Mar2025 |
| Property, a focus on Scotland Oct24 |
| Property Report Oct2024 |
RIO Regular Reports |
| Regular USD Report Oct2025 |
| Regular USD Report Jul2025 |
| Regular USD Report May2025 |
| Regular GBP Report May2025 |
| Regular GBP Report Apr2025 |
General RIO Club Reports |
| RIO Smart Money Oct2025 |
| Britain not so Great for some |
| Gold Report Nov2023 |
| Gold Jan2023 |
| End of Year Summary 2022 |
General Investment Reports |
| Will the Fed cut interest rates? |
| Gold |
| The UK Budget |
| The Election is Over! |
| Gold Report Mar2024 |
RIO Charity and Sponsorship |
| RIO Sponsors ATGT 2025 |
| RIO Sponsors GTC Marbella 2025 |
| RIO Sponsors Garden Party Spain |
| RIO Sponsors FUFGT 2025 |
| RIO Sponsors German Open Cup 2025 |
Health Wealth and Happiness

Download the historic RIO magazines
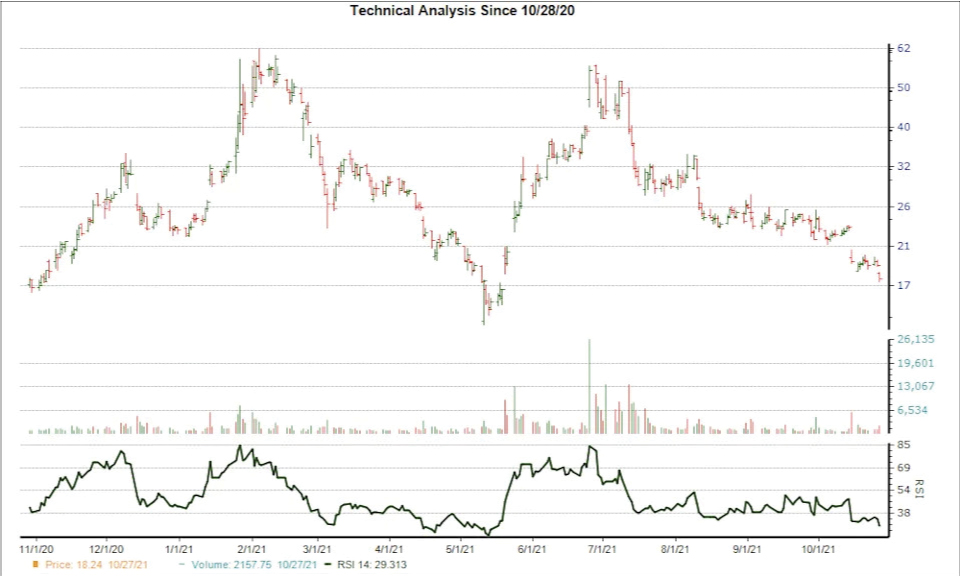
Here's Why Virgin Galactic (SPCE) is Poised for a Turnaround After Losing 41.7% in 4 WeeksVirgin Galactic (SPCE) has been on a downward spiral lately with significant selling pressure. After declining 41.7% over the past four weeks, the stock looks well positioned for a trend reversal as it is now in oversold territory and there is strong agreement among Wall Street analysts that the company will report better earnings than they predicted earlier. How to Determine if a Stock is Oversold We use Relative Strength Index (RSI), one of the most commonly used technical indicators, for spotting whether a stock is oversold. This is a momentum oscillator that measures the speed and change of price movements. RSI oscillates between zero and 100. Usually, a stock is considered oversold when its RSI reading falls below 30. Technically, every stock oscillates between being overbought and oversold irrespective of the quality of their fundamentals. And the beauty of RSI is that it helps you quickly and easily check if a stock's price is reaching a point of reversal. So, by this measure, if a stock has gotten too far below its fair value just because of unwarranted selling pressure, investors may start looking for entry opportunities in the stock for benefitting from the inevitable rebound. However, like every investing tool, RSI has its limitations, and should not be used alone for making an investment decision. Why a Trend Reversal is Due for SPCE The RSI reading of 20.71 for SPCE is an indication that the heavy selling could be in the process of exhausting itself, so the stock could bounce back in a quest for reaching the old equilibrium of supply and demand.
The RSI value is not the only factor that indicates a potential turnaround for the stock in the near term. On the fundamental side, there has been strong agreement among the sell-side analysts covering the stock in raising earnings estimates for the current year. Over the last 30 days, the consensus EPS estimate for SPCE has increased 0.6%. And an upward trend in earnings estimate revisions usually translates into price appreciation in the near term. |